1. Pressure Enthalpy Diagram
1. Enthalpy
It is a kind of energy, used to indicate the thermal state parameter of the state of the refrigerant, it represents the size of the total energy of the refrigerant; namely:
The enthalpy of the refrigerant is equal to the sum of the internal and external energy of the refrigerant (H=U+pV).
Enthalpy is represented by the symbol "h" or "i", and the unit is "J/kg" or "kJ/kg".

In thermodynamics, the physical meaning of enthalpy refers to the heat contained in a substance at a specific temperature.
In the refrigeration process, when the refrigerant flows in the system, its internal energy and external work always appear at the same time. Therefore, the introduction of the state parameter "enthalpy" can simplify the thermal calculation:
dQ =dh (where Q is heat, h is enthalpy, d is variable)
Enthalpy is a state parameter, which is only related to the initial and final state of the system and has nothing to do with the process.
For example: a certain refrigerant changes from state 1 (heat content h1) to state 2 (heat content h2) through heat absorption, then the amount of heat (thermal variable) dQ absorbed during the heat absorption process is before heat absorption The enthalpy difference between the two state points after endothermic;
That is: dQ = h2-h1, and has nothing to do with the process of heat absorption.
2. Thermal calculation of refrigeration system-use of enthalpy
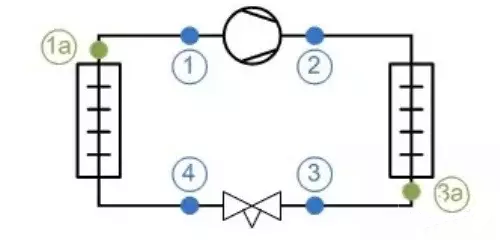

The above picture is the pressure enthalpy diagram of a refrigeration system, let's take a look at the parameters of these state points:

Then we can calculate the unit refrigeration capacity of the refrigeration system:
If we have the refrigerant flow, we can calculate the refrigeration capacity of the refrigeration system.
2. Temperature entropy diagram
1. Entropy
It is a thermal state parameter used to indicate the state of the refrigerant. It is represented by the symbol "s" and the unit is "J/kg·K" or "kJ/kg·K".
Entropy describes the amount of heat a refrigerant has under certain temperature conditions.
When the refrigerant absorbs heat, the entropy value increases;
When the refrigerant releases heat, the entropy value decreases;
The refrigerant neither absorbs nor releases heat, and the entropy value does not change.
The compression process of the compressor is the process of the refrigerant from low pressure to high pressure. At this time, the refrigerant neither absorbs nor releases heat, so the compression process of the compressor is a process of isentropic compression.
The ratio of the heat "dQ" absorbed or released by the refrigerant in the process of state change to the thermodynamic temperature "T" of the refrigerant at this time is the change in entropy, namely:
Ds =dQ/T = s2 – s1
Then: dQ = ds·T = (s2 – s1) T
In other words, the amount of heat absorbed or released by a substance is equal to the product of the thermodynamic temperature of the substance and the change in entropy.
2. Temperature-entropy diagram of refrigeration system: T-S diagram
Representation of the thermodynamic cycle of the refrigeration system on the T-S diagram:


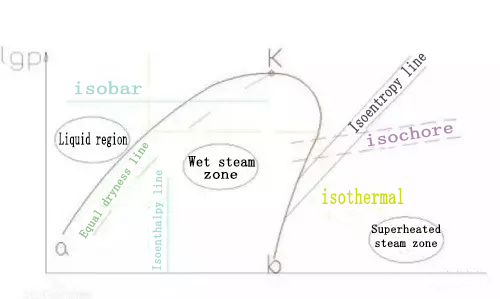
The meaning of the pressure enthalpy diagram curve can be one point (critical point), two lines (saturated liquid line, saturated steam line), three zones (liquid zone, two-phase zone, gas zone), five states (supercooled liquid state, saturated liquid State, superheated steam state, saturated steam state, wet steam state) and eight lines (isobar, isenthalpy, saturated liquid, saturated steam, isothermal, isoentropic, isothermal, isothermal ) To summarize.
Critical point K and saturation curve
The critical point K is the intersection of two thick solid lines. At this point, the difference between the liquid state and the gas state of the refrigerant disappears.
The thick solid line Ka on the left of the K point is the saturated liquid line, and any point on the Ka line is a saturated liquid with the corresponding pressure; the thick solid line Kb on the right of the K point is the saturated vapor line, at any point on the Kb line The state is saturated steam state, or dry steam.
Three status areas
Ka left side-supercooled liquid zone, the refrigerant temperature in this zone is lower than the saturation temperature under the same pressure;
Kb on the right-superheated steam zone, the steam temperature in this zone is higher than the saturation temperature under the same pressure;
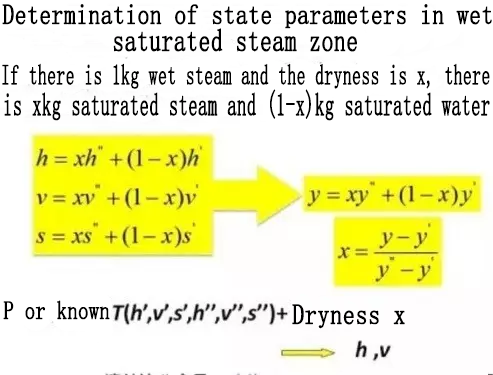
Between Ka and Kb-the wet vapor zone, that is, the gas-liquid coexistence zone. The refrigerant in this zone is saturated, and there is a one-to-one correspondence between pressure and temperature.
In the refrigerator, the evaporation and condensation process is mainly carried out in the wet vapor zone, and the compression process is carried out in the superheated vapor zone.
Six sets of isoparametric lines
There are eight types of lines in the refrigerant pressure-enthalpy (LgP-E) diagram:
Isobaric P(LgP) Isenthalpy (Enthalpy) Saturated Liquid (Saturated Liquid) Isentropy (Entropy)
Isotherm (Volume) Saturated Vapor (Saturated Vapor) Isotherm (Quality) Isotherm (Temperature)
(1) Isobaric lines: the horizontal thin solid lines parallel to the abscissa axis on the graph are all isobars, and the pressures of the same horizontal line are equal.
(2) Isenthalpy: The thin solid line perpendicular to the abscissa axis on the graph is an isenthalpy. All working fluids on the same isenthalpy have the same enthalpy value regardless of their state.
(3) Isotherm: The isotherm represented by the dotted line on the map. The shape of the isotherm varies in different regions. In the supercooling zone, the isotherm is almost perpendicular to the abscissa axis; in the wet steam zone, it is a horizontal line parallel to the abscissa axis; in the superheated steam zone, it is a sharply curved inclined line to the lower right. .
(4) Isentropic line: the thin solid line curved from left to upper right on the graph is the isentropic line. The compression process of the refrigerant proceeds along the isentropic line, so the isentropic line in the superheated vapor zone is used more. The isentropic line in the lgp-h diagram takes the saturated vapor line as the starting point.
(5) Contour line: The dashed line that curves upwards slightly from left to right on the graph is the contour line. Compared with the isoentropic curve, the iso-specific volume curve is flatter. The constant volume line is commonly used in refrigerators to check the specific volume value of the suction point of the refrigeration compressor.
(6) Isodryness line: Starting from the critical point K, the line connecting the same dryness points in the wet vapor zone is the isodryness line. It only exists in the wet vapor zone.
Among the above six state parameters (p, t, v, x, h, s), as long as any two of the state parameter values are known, the thermal state of the refrigerant can be determined. Determine its state point on the lgp-h diagram, and check the remaining four state parameters of this point.
add a little knowledge point: